HL Paper 3
Reproduction in fish is called spawning. The males and females in a population that are mature enough to reproduce are the spawning stock. In order to provide better fisheries management and conservation decisions, there is a need to investigate the relationship between spawning stock and environmental conditions. The graph shows the North Sea cod spawning biomass and sea surface temperatures.
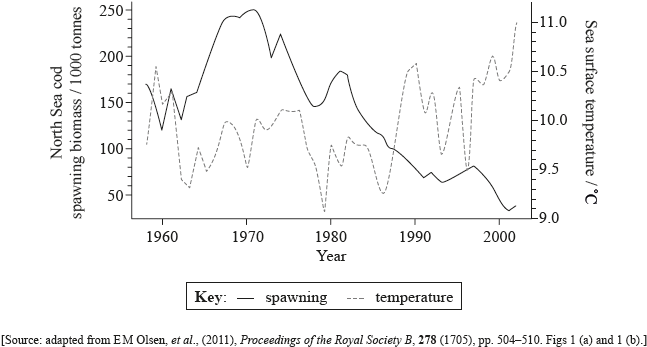
State the sea surface temperature when the North Sea cod spawning biomass was the highest, giving the units.
State the North Sea cod spawning biomass when the sea surface temperature was the lowest, giving the units.
Outline the trends in North Sea cod spawning biomass between 1960 and 2000.
Evaluate the evidence provided by the data, for the prediction that North Sea cod will become extinct if sea temperatures continue to rise.
Suggest one factor, other than sea surface temperature, that might influence the North Sea Cod spawning
Markscheme
9.85 °C (accept answers in the range of 9.75 °C to 9.95 °C units required)
152 000 tonnes } (accept answers in the range of 150 000 tonnes to 155 000 tonnes units required)
(rapid) increase between 1960 and 1970;
decrease from 1970 to beyond 2000/2002:
brief reversal/slight increase between 1981 and 1982;
Evidence supporting the prediction
biomass trend declines as temperature trend increases / negative correlation from mid-’80s;
Evidence not supporting the prediction
no correlation between (finer) fluctuations in sea temperature and biomass between 1960 and mid-’80s;
peaks in sea temperature in 1960, 1990 and 2000 at same level with different biomass;
dip in both curves at the end of ’70s;
significance hard to demonstrate without statistical tools/OWTTE;
overfishing / predation / availability of the food / pollution / disease
Mark only the first answer if more than one provided
Examiners report
Most figured out the correct answer, but many were slightly out of range (10 °C). Spawning biomass was a different story: many were out of range and many also read the units incorrectly (e.g. 150/1000 tonnes instead of 150000 tonnes). Although most gained marks, outlining the trends was difficult for many, and evaluating the evidence for possible extinction was worse. For both questions, candidates had difficulty to relate to the time line; many were using the temperature (dependent variable) as a reference instead of the years (independent variable). Factors influencing the spawning biomass seemed random, some getting the correct answer.
Most figured out the correct answer, but many were slightly out of range (10 °C). Spawning biomass was a different story: many were out of range and many also read the units incorrectly (e.g. 150/1000 tonnes instead of 150000 tonnes). Although most gained marks, outlining the trends was difficult for many, and evaluating the evidence for possible extinction was worse. For both questions, candidates had difficulty to relate to the time line; many were using the temperature (dependent variable) as a reference instead of the years (independent variable). Factors influencing the spawning biomass seemed random, some getting the correct answer.
Most figured out the correct answer, but many were slightly out of range (10 °C). Spawning biomass was a different story: many were out of range and many also read the units incorrectly (e.g. 150/1000 tonnes instead of 150000 tonnes). Although most gained marks, outlining the trends was difficult for many, and evaluating the evidence for possible extinction was worse. For both questions, candidates had difficulty to relate to the time line; many were using the temperature (dependent variable) as a reference instead of the years (independent variable). Factors influencing the spawning biomass seemed random, some getting the correct answer.
Most figured out the correct answer, but many were slightly out of range (10 °C). Spawning biomass was a different story: many were out of range and many also read the units incorrectly (e.g. 150/1000 tonnes instead of 150000 tonnes). Although most gained marks, outlining the trends was difficult for many, and evaluating the evidence for possible extinction was worse. For both questions, candidates had difficulty to relate to the time line; many were using the temperature (dependent variable) as a reference instead of the years (independent variable). Factors influencing the spawning biomass seemed random, some getting the correct answer.
Most figured out the correct answer, but many were slightly out of range (10 °C). Spawning biomass was a different story: many were out of range and many also read the units incorrectly (e.g. 150/1000 tonnes instead of 150000 tonnes). Although most gained marks, outlining the trends was difficult for many, and evaluating the evidence for possible extinction was worse. For both questions, candidates had difficulty to relate to the time line; many were using the temperature (dependent variable) as a reference instead of the years (independent variable). Factors influencing the spawning biomass seemed random, some getting the correct answer.
Increasing carbon dioxide concentration in the atmosphere leads to acidification of the ocean. This in turn reduces the amount of dissolved calcium carbonate. A study was undertaken to investigate the effect of increasing the concentration of atmospheric carbon dioxide on the calcification rate of marine organisms. Calcification is the uptake of calcium into the bodies and shells of marine organisms. The study was undertaken inside Biosphere-2, a large-scale closed mesocosm. The graph shows the results of the data collection.

State the relationship between atmospheric carbon dioxide and calcification rates.
Suggest one advantage of using a mesocosm in this experiment.
Outline one way in which reef-building corals are affected by increasing atmospheric carbon dioxide.
Markscheme
Negative correlation/inverse relationship (Do not accept “negative” alone)
Exponential decrease in calcification as pCO2 /concentration/atmospheric CO2 rises
As CO2 increases calcification decreases
Allows atmospheric CO2 concentration to be controlled/varied
Control other variables
Closed system so no external processes affect experiment
Alternative 1
Corals have parts/shells/«exo»skeleton made of calcium carbonate
Calcium carbonate «shells» dissolve in acid conditions
Acid/high CO2 conditions reduces availability of calcium carbonate «for forming shells»
OR
negatively affects enzymes involved in calcification
Alternative 2
CO2 is «significant» greenhouse gas causing rise in ocean temperatures
Higher ocean temperatures/acidification leads to rejection of zooxanthellae
OR
higher ocean temperatures/acidification leads to coral bleaching
Examiners report
The vast majority were able to read the graph correctly, noting that as CO2 increased, calcification decreased. Only stronger candidates used terms such as ‘negative correlation’ or ‘inverse relationship’.
The majority were also able to get the mark here, usually for noting that the mesocosm allowed for control of all variables although many seemed doubtful as to what a mesocosm was.
Candidates found this difficult and few could correctly outline why increasing CO2 levels affected coral. Many simply repeated the stem of the question. Few seemed to know that coral had an exoskeleton or shell made of calcium carbonate, instead referring in general to the ‘reef’. Few also knew the relationship between increasing CO2 levels and coral bleaching.
One of the distinguishing features of the Archaea is that they are capable of inhabiting extreme environments such as extreme temperatures or anoxic conditions. Outline other extreme environments inhabited by the Archaea.
Describe how methane can be made from biomass.
Markscheme
a. high salinity (halophiles);
b. example of high salinity (eg Dead Sea, Great Salt Lake Utah);
c. extreme pH (acidophiles/alkalinophiles);
d. high pressure (barophiles) / deep oceans;
a. anaerobic fermentation of biomass/manure/suitable biomass material;
b. bacteria convert biomass into organic acids and alcohol;
c. bacteria produce CO2 and H2;
d. methanogenic bacteria produce methane;
e. by reducing/reacting CO2 with hydrogen gas/
f. or directly from organic acids/acetate/
Accept suitable word or chemical equations for the last two marking points.
Examiners report
This was the least popular of the HL options but it was encouraging to note some schools studying it with some good standards seen.
Most candidates were able to get a mark for mentioning the high salinity that halophiles can withstand. Although the question clearly said to outline other extreme environments inhabited by Archaea, many candidates still listed the anaerobic conditions of methanogens, which was in the stem, and thus did not get a mark.
This was the least popular of the HL options but it was encouraging to note some schools studying it with some good standards seen.
The description of methane production from biomass was done well by the better candidates who were able to give the products the various bacteria produced, often with correct equations. The weaker candidates only knew that methanogenic bacteria produced methane.
The graph below shows the monthly mean values of terrestrial invertebrates from May 1997 to June 1998 in the northern hemisphere. The light line shows the biomass of invertebrates which are prey to forest birds (terrestrial invertebrate biomass). The darker line shows the invertebrates which lived in the stream and have moved to the forest (aquatic invertebrate flux or movement). The black bars on the horizontal line at the bottom show periods when trees have leaves and the white bars show periods of defoliation.

State the mean terrestrial invertebrate biomass measured in August.
Describe the trend in the aquatic invertebrate flux.
Suggest the relationship between defoliation and the amount of terrestrial invertebrates in the forest.
Suggest a possible explanation for the pattern in aquatic invertebrate flux to the forest seen between the months of June and December.
Allochthonous organisms are those which have migrated from one place to another, such as the aquatic invertebrates in this study. Suggest one effect of allochthonous invertebrates in this environment.
Markscheme
166 mg m–2 (Allow answers in the range of 162–168 mg m–2)
rapid rise and fall between April and August;
peak in May/June;
fluctuates between August/September and December;
low December/January until February/March;
cyclical;
negative relationship/during period of defoliation, biomass/amount (of terrestrial invertebrates) is at its lowest;
less leaves means less food/habitats / easier for predators to see invertebrates;
defoliation occurs in winter/autumn and the cold may kill invertebrates;
(aquatic invertebrate flux) decreases because movement to the forest has occurred (by adult forms) / fewer aquatic invertebrates left in the stream so fewer are moving;
fluctuation due to movement of different species/different life cycles/second generation;
decreases because invertebrates left at the beginning of winter/cold season;
(adult forms) move to utilize (changes in) food supply in forest;
increased/alternative food source for (forest) organisms/forest birds;
decreased food supply for aquatic organisms;
can cause changes in the food webs/pyramids of energy;
Examiners report
Almost all candidates correctly read the graph to find the mean terrestrial invertebrate biomass.
Most candidates were able to correctly describe the trend in the aquatic invertebrate flux for two marks.
The majority of candidates were able to get one mark for seeing the negative relationship between defoliation and biomass and some were able to get a second mark for suggesting why this might be.
Candidates struggled to suggest explanations for the pattern of movement between the aquatic environment and forest. Some were able to get a mark for suggesting adult forms moved to the forest to utilize food supplies. Almost none were able to suggest that fewer were moving into the forest as the adult forms of the invertebrates had already migrated and therefore few were left in the stream or that the fluctuations were due to different life cycles or species. In retrospect, this question did seem too difficult for candidates considering the information they were given.
Candidates also struggled with this section of the question. Although the word allochonthous was briefly given in the question stem, it seemed that candidates were still not able to understand enough to answer the question. A few were able to get the mark for indicating that the aquatic invertebrates that migrated to the forest would provide an alternative food source for the forest birds and others indicated that this would cause changes to the food web.
Mean annual chlorophyll concentration was measured in surface water of Narragansett Bay along the Atlantic coast of the USA, from 1971 to 2006. Field data of chlorophyll concentrations are shown below.

Suggest a hypothesis for the trend in the graph.
Mesocosm experiments using water from Narragansett Bay were completed in the laboratory during a six month period. Discuss advantages and limitations of carrying out mesocosm investigations.
Markscheme
a. decrease in chlorophyll concentrations as decrease in phytoplankton/plants
b. due to increase in pollution / increase in sea temperatures / decrease in pH/climate change
Accept other reasonable reason for mp b.
Advantages of mesocosm experiments:
a. scientist can alter/manipulate/control environmental conditions
b. allows carrying out experiments with many samples / replicates
c. ease of collection of continuous data
Limitations of mesocosm experiments:
d. difficult to mimic natural environmental conditions exactly
e. Natural environments change /are not static
Needs to suggest advantage and limitation for full marks.
Examiners report
The worm Branchiobdella italica lives on the external surface of the freshwater crayfish Austropotamobius pallipes. A study was carried out in a river in central Liguria, north-western Italy, of the range of sizes of B. italica found on adult A. pallipes.

Describe the body length frequency of the B. italica worms collected in this study.
The relationship between A. pallipes and B. italica is mutualistic.
A. pallipes feeds on algae and another worm, B. exodonta, lives inside A. pallipes as a parasite. State the trophic level of B. exodonta in this food chain.
Distinguish between mutualism and parasitism, providing another example of mutualism and another example of parasitism.
Markscheme
a. higher frequency of medium length worms
b. shows normal distribution
c. lower frequency at extremes
Allow correct numerical description of these points.
secondary consumer / third trophic level
a. in parasitism only one organism benefits whereas in mutualism both benefit
b. example for both parasitism AND mutualism
Do not allow B. italica or B. exodonta as examples.
eg parasitic: human tapeworms AND mutualism: bacteria in human digestive tract
Examiners report
A colony of a marine diving bird, Brunnich’s guillemot (Uria lomvia), lives on the southern limits of the Arctic on Coats Island. Brunnich’s guillemots feed principally on Arctic cod (Arctogadus glacialis) which are characteristic of Arctic waters.
The graph shows the changes in ice cover on Coats Island over a period of 19 years.

At Coats Island, chick mass at 14 days was measured in most years between 1988 and 2002. The scattergraph below shows the results, plotted against proportion of ice cover.

Outline the changes in ice cover shown in the data above.
Suggest one reason for the changes in ice cover.
Outline the relationship between ice cover and the mass of 14-day-old chicks on Coats Island.
Suggest reasons for the relationship.
Predict, with a reason, the change in the mass of chicks in the years ahead.
Markscheme
downward trend / decreasing slightly;
the data show much variability/fluctuates;
warmer air/atmosphere/water temperatures/global warming (bringing about more ice melt)
increase in summer ice cover has a positive effect on mass increase;
high proportion of ice cover has little effect / (slightly) negative effect on chick mass/growth;
changes in (water) temperature/climate change influence fish populations/ food available for chick growth;
changes in habitat affect chick growth / rearing of chicks;
mass may go down as proportion of ice cover has decreased;
mass may increase as most recent data shown in (bar) graph shows increasing proportion of ice area;
Examiners report
Almost all candidates stated a decreasing trend although few mentioned the fluctuation in the data seen. There were some candidates simply restating data and this gained no marks.
All candidates made reference to global warming being the reason for the reduction in ice cover.
Many candidates gave good trend here suggesting that the mass of chicks did increase with increasing ice cover, up to a certain point and following this, the mass decreased, thus gaining 2 marks. This showed good data interpretation skills even if it may go against their logic.
The best candidates had clearly read the information given at the start of the question about the Brunnich`s guillemots feeding on Arctic cod, characteristic of Arctic waters. The best candidates did answer that if there was less ice (due to global warming) that there may be less cod, so less food, so decrease in chick mass, which was very pleasing to see. Others did suggest some good logical answers concerning changes to habits, but these answers did not really include all the data given, although marks could be awarded if they did made sense.
Many candidates successfully suggested that with global warming there would be a decrease in chick mass (due to less cod). This meant that these candidates were really using the data given.
The larval stage of the fly Eurosta solidaginis develops in the plant Solidago altissima. The larva secretes a chemical which causes plant tissue to grow around it forming a swelling called a gall. The gall provides the developing insect with protection from predators.

The E. solidaginis fly is preyed upon by the parasitic wasp Eurytoma gigantea. The graph shows the relationship between gall diameter and the percentage of flies that avoid predation by E. gigantea.
In order to form galls, the insects choose a location where cell division occurs at a high rate. State the term for a region of rapid cell division within a plant.
Describe the relationship between gall diameter and percentage survival of E. solidaginis.
Explain the concept of directional selection with respect to this example.
Markscheme
«apical» meristem/shoot apex
a. percentage survival is higher with larger diameter galls
OR
positive relationship
b. variation/outlier at the lower diameters OWTTE
c. little variation in survival percentage at highest diameters OWTTE
a. directional selection is when an extreme phenotype/characteristic is favoured OWTTE
b. flies that form small galls will be selectively predated OWTTE – accept vice versa
c. over time, flies that produce small galls will become rarer
OR
mean gall size will increase